Analyze the data used:
The H3K4me3, H3K27me3, H3K79me3 and gene expression data in SRA format of CRC cell lines (DLD1: colorectal cancer cell line, SA: mesenchymal-like DLD1 derivative, METS: metastasis-derived DLD1 derivative) were downloaded from GEO. The reference number is GSE85688. It is worth noting that only three kinds of HMs data are available here. The RefSeq genes of the human genome (hg19) were downloaded from UCSC.Partition of promoter regions:
Based on the RefSeq genes annotation file, the functional region of (-2000, 2000) bp flanking the TSS was divided into 40 bins of 100 bp in size for each gene.Specification:
DLD1: colorectal cancer cell line; SA: mesenchymal-like DLD1 derivative; METS: metastasis-derived DLD1 derivative;EMT:DLD1 cells to SA cells;MET:SA cells to METS cells;
Tips:The r denotes the Pearson correlation coefficient between histone modification levels in promoters and gene expression levels;E represents the gene expression level;
Analysis result of figure above:
H3K4me3 and H3K79me3 were positively correlated with gene expression in DLD1, SA and METS cells, while H3K27me3 was negatively correlated with gene expression.Rank | EU-MD Genes | ED-MU Genes |
---|---|---|
1 | H3K79me3_3bin | H3K79me3_5bin |
2 | H3K79me3_-1bin | H3K79me3_-4bin |
3 | H3K79me3_4bin | H3K79me3_-8bin |
4 | H3K79me3_-10bin | H3K79me3_12bin |
5 | H3K79me3_19bin | H3K79me3_-3bin |
6 | H3K79me3_-11bin | H3K79me3_4bin |
7 | H3K79me3_-12bin | H3K79me3_-5bin |
8 | H3K79me3_9bin | H3K79me3_-14bin |
9 | H3K79me3_20bin | H3K79me3_13bin |
10 | H3K79me3_-3bin | H3K79me3_-9bin |
11 | H3K79me3_8bin | H3K4me3_4bin |
12 | H3K79me3_10bin | H3K79me3_-2bin |
13 | H3K79me3_-4bin | H3K79me3_-1bin |
14 | H3K79me3_-5bin | H3K79me3_19bin |
15 | H3K79me3_-19bin | H3K79me3_7bin |
16 | H3K79me3_15bin | H3K79me3_8bin |
17 | H3K79me3_-16bin | H3K79me3_1bin |
18 | H3K79me3_-6bin | H3K79me3_20bin |
19 | H3K79me3_16bin | H3K79me3_2bin |
20 | H3K79me3_13bin | H3K79me3_6bin |
Tips:EU-MD Genes:the overlapped genes that were up-regulated in EMT and down-regulated in MET;ED-MU Genes:the overlapped genes that were down-regulated in EMT and up-regulated in MET;
If you want to know more, please click here. More detailed information can be found in the "Detail" button on the search page.
If you want to know more, please click the references below.
Zhai Y Y, Li Q Z, Chen Y L, et al. Identification of Key Histone Modifications and Hub Genes for Colorectal Cancer Metastasis[J]. Current Bioinformatics, 2022, 17(2): 206-216.Analyze the data used:
The genome-wide scale 11 HMs, 2 TFs, and polyAmRNAseq data in both human breast cancer cells (MCF-7) and human normal mammary epithelial cells (HMEC) were downloaded from the ENCODE.All data was annotated based on the Human reference genome hg38 (GRCh38). GRCh38 was downloaded from UCSC.Division of flanking TSSs area:
Based on the RefSeq genes annotation file,the region of up- and down-stream 5 kb of the TSS for each RefSeq gene was divided into 100 bins (from 1-th to 100-th bins).Specification:
HM: histone modifications; TF: transcription factor;


Tips:TSSs: transcription start sites;
Analysis result of figure above:
H3K79me2 levels in most bins of TSS downstream are increased for MCF-7.The levels of H3K27ac in MCF-7 are obviously increased in almost every bin flanking TSSs.H3K4me1 signal in each bin flanking TSSs is clearly enhanced for MCF-7.
Analysis result of figure above:
H3K27ac, H3K9ac, and H3K4me1/2/3 have stronger positive correlations with gene expression in MCF-7. However, the positive correlations between H3K79me2 and gene expression are obvious within TSS downstream . Moreover, around the 60-th bin, the correlations between H3K79me2 and gene expression are the strongest.
Analysis result of figure above:
The change of H3K79me2 is especially obvious within TSS downstream.The signal changes of H3K27ac are obvious nearby TSSs (about the 40-th to 80-th bins).
Analysis result of figure above:
The change of H3K79me2 is especially obvious within TSS downstream. Particularly, the difference of H3K79me2 levels between MCF-7 and HMEC around the 60-th bin is about 6 times. The signal changes of H3K27ac are obvious nearby TSSs (about the 40-th to 80-th bins), and H3K27ac level difference between the two types of cells is about 4.5 times. H3K4me1 changes evidently in almost 100 bins flanking TSSs. Moreover, the variations of three HMs are almost coincided with the changes of gene expression levels in MCF-7. The changes of H3K79me2, H3K27ac, and H3K4me1 may lead to the increase or decrease of gene expression in breast cancer.
Analysis result of figure above:
In the up-regulated genes, H3K79me2 is positively correlated with H3K4me3. H3K4me3 is strong negatively correlated with H3K27me3.
Analysis result of figure above:
For the down-regulated genes, there is a clear cluster of strong positively correlated HM pairs (H3K27ac, H3K9ac, and H3K4me2) ; H3K79me2 is strongly related to H3K4me2 and H3K27ac, respectively.up-regulated gene | down-regulated gene |
---|---|
SPTSSB | CDCP1 |
LONRF2 | GPX1 |
GREB1 | TINAGL1 |
C4orf19 | TM4SF1 |
INHBB | FGFBP1 |
IGFBP5 | PCSK9 |
NPNT | IFI16 |
NUP210 | IL1B |
PRLR | TFCP2L1 |
NPY1R | F3 |
If you want to know more, please click the references below.
Jin W, Li Q Z, Liu Y, et al. Effect of the key histone modifications on the expression of genes related to breast cancer[J]. Genomics, 2020, 112(1): 853-858.Analyze the data used:
The human genome location information (hg19) is downloaded from the UCSC database.The genome-wide profiles of 11 HMs and polyA plus RNA-seq data in GM12878 (B-lymphoblastoid cell, normal) and K562 (CML cell, cancer) are deposited in the ENCODE database.Division of flanking TSSs area:
Based on the RefSeq genes annotation file,the region of up- and down-stream 5 kb of the TSS for each RefSeq gene was divided into 100 bins (from 1-th to 100-th bins).Specification:
HM: histone modifications;
Tips:Position 0 represents the TSS;
Analysis result of figure above:
Among the 11 HMs, except H2AFZ and H3K4me2, the rest of the HMs display remarkably dynamic changes in CML cells as compared with that in normal cells. The changes of H2AFZ signals mostly appear in the downstream regions of TSS, and H3K4me2 signal changes are significantly concentrated in the upstream regions of TSS.
Analysis result of figure above:
For the down-DEGs, except H3K27me3, H3K4me3, and H4K20me1, the signals of other HMs reduce significantly in most bins within CML cells.
Analysis result of figure above:
For the up-DEGs, except H3K27me3, the signals of other HMs are increased across all bins within CML cell lines.
Analysis result of figure above:
The signals of H3K27me3 increase in all 100 bins within CML cells.The signals of H3K4me3 rise from the −15th to the 50th bins. The H4K20me1 signals are slightly enhanced from the −19th to the 50th bins.Cluster analysis exhibits that the impacts of HM signal changes on the expression level changes of downDEGs are divided into two categories. The first category includes H3K27me3, H3K9me3, and H4K20me1, while other HMs are classified into the second category . The increased signals of HMs in category 1 and the decreased signals of HMs within category 2 together lead to the down-regulation of gene expression.
Analysis result of figure above:
The signals of H3K27me3 slightly decrease in all 100 bins within CML cells. Cluster analysis displays that the influences of HM signal changes on the expression changes of up-DEGs are also divided into two categories. The reduced signals of HMs (especially H3K27me3) in category 1 and the increased signals of HMs in category 2 together induce the up-regulation of gene expression levels, and those HMs in category 2 have stronger inducibility within the upstream regions of TSS.
Analysis result of figure above:
It is noteworthy that H3K79me2 plays the most important role in almost all 100 bins, followed by H3K36me3. H3K27ac is relatively important for the regulation of gene expressions from the -20th to the 10th bins. H3K4me1 exerts its regulatory function from the 10th to the 50th bins. H3K4me3 has a crucial impact on gene expression changes in the -50th to -10th bins and the 20th–50th bins.gene |
---|
Phactr1 |
Gbp4 |
Tp53 |
Wt1 |
Dnmt3a |
Cacna1b |
If you want to know more, please click the references below.
Zhang L Q , Fan G L , Liu J J ,et al.Identification of Key Histone Modifications and Their Regulatory Regions on Gene Expression Level Changes in Chronic Myelogenous Leukemia[J].Frontiers in cell and developmental biology, 8:621578[2023-06-27].DOI:10.3389/fcell.2020.621578.Analyze the data used:
Human reference genome annotation data (GRCH38) are available in the UCSC Genome Browser.The genome-wide profiles of 11 HMs and polyA+ RNA-seq data for A549 cells (LUAD cells, tumor) and IMR90 cells (lung fibroblasts cells, normal) were indexed from the ENCODE database.Raw clinical profiles and RNA-seq data for patients with LUAD were retrieved from the TCGA dataset.Division of flanking TSSs area:
Based on the RefSeq genes annotation file,the region of up- and down-stream 5 kb of the TSS for each RefSeq gene was divided into 100 bins (from 1-th to 100-th bins).Specification:
HM: histone modifications;
Analysis result of figure above:
For the up-regulation differentially expressed genes, the effects of HM signal changes on gene expression changes were stronger in the proximal regions of TSS than those in the distal regions.
Analysis result of figure above:
For the down-regulation differentially expressed genes, HM signal changes in the distal regions of TSS contributed more to gene expression changes than those in the proximal regions.
If you want to know more, please click the references below.
Zhang L Q, Yang H, Liu J J, et al. Recognition of driver genes with potential prognostic implications in lung adenocarcinoma based on H3K79me2[J]. Computational and Structural Biotechnology Journal, 2022, 20: 5535-5546.Analyze the data used:
The RNA-seq, DNA methylation, clinical and ATAC-seq data of human colon adenocarcinoma tissues were downloaded from The Cancer Genome Atlas database.The RefSeq genes annotation files of the Human reference genome hg38 (GRCh38) were got from UCSC.The interval of enhancer region was obtained from the FANTOM5 database. The annotation file of CGI region was downloaded from the UCSC database.
Based on the RefSeq genes annotation file, the genome was divided into the following twelve regions:
TSS1500
, 5' UTR
, 3' UTR
, TSS200
, body
, 1stexon
, N_Shore
, S_Shore
, N_Shelf
, S_Shelf
, CGI, enhancer


Tips:HDGs-RC:The hypermethylated downregulated gene;HUGs-RC:The hypermethylated upregulated gene;
Analysis result of figure above:
The DNA methylation distributions in the two tissues were obviously different in HDGs-RC, especially the promoter regions (including TSS1500, TSS200, 5’UTR and 1stExon regions).Therefore, the hypermethylation in promoter regions is possible to lead to the downregulation of gene expression and inhibit gene expression. For the HUGs- RC, the hypermethylation of gene body and shore region are helpful to reinforce gene expression

Analysis result of figure above:
For down-regulated genes, there are four DNA methylation modification clusters that have strong positive correlation to inhibiting genes CD38, SEMA6D, IRF4 and IKZF1 expressions, respectively, (cg02183671, cg15994026, and cg26043257), (cg22389950, cg01053260, cg10864878, and cg17875483), (cg06392169, cg12741420, cg17228900, cg21277995, and cg06223767), and (cg16697214 and cg07589773) . For up-regulated genes, there is one DNA methylation modification cluster with strong positive correlation (cg04052466, cg26000619, cg26659805, and cg11325997), that promotes gene AMH expression .If you want to know more, please click here. More detailed information can be found in the "Detail" button on the search page.
If you want to know more, please click the references below.
Bai H, Li Q Z, Qi Y C, et al. The prediction of tumor and normal tissues based on the DNA methylation values of ten key sites[J]. Biochimica et Biophysica Acta (BBA)-Gene Regulatory Mechanisms, 2022, 1865(6): 194841.Analyze the data used:
The DNA methylation data (Illumina Infinium Human Methylation 450K), gene expression data, and clinical data of human LIHC (liver hepatocellular carcinoma) tissue samples and adjacent normal tissue samples were downloaded from the TCGA database(hg38).The human reference genome annotation file (RefSeq, hg38) was downloaded from the UCSC database.The enhancer region location file of human was downloaded from the FANTOM5 database.The annotation file of the CGI region was downloaded from the UCSC database.
Based on the RefSeq genes annotation file, the genome was divided into the following twelve regions:
Promoter
, 5' UTR
, 3' UTR
, intergenic
, enhancer
, N_Shore
, S_Shore
, N_Shelf
, S_Shelf
, exon, intron, CGI regions.
The 12 regions are further divided:
The promoter region was evenly divided into 30 bins, where each bin was 100 bp. The other 11 regions were normalized into 10 bins.


Tips:Hyper means hypermethylated;Hypo means hypomethylated;
Analysis result of figure above:
For the functional regions around the CGI, the distribution of differentially methylated CpG sites in the CGI region is significantly enriched, especially the edge regions on both sides of the CGI. In the genome regions (enhancer, promoter, 5'UTR, exon, intron, 3'UTR, and intergenic), the differentially methylated CpG sites are more abundant in the enhancer, promoter and exon regions, especially in the vicinity of the TSS (bin25). The distribution density of hypomethylated CpG sites is higher than that of hypermethylated CpG sites in the N_Shelf, N_Shore, S_Shore, and S_Shelf regions. In the edge regions on both sides of the CGI, the hypomethylated CpG sites are more abundant than the hypermethylated CpG sites. On the contrary, the distribution density of hypermethylated CpG sites is more than that of hypomethylated CpG sites in the interior of the CGI. The distribution density of hypomethylated CpG sites is greater than that of hypermethylated CpG sites in different regions of the genome.

Tips:T means tumor tissues;N means normal tissues;
Analysis result of figure above:
The original methylation levels in normal tissues are very low (or high) but the methylation levels increase (or decrease) during tumor development, and finally a stable methylation level is reached in the tumor. This stable distribution pattern of methylation levels may be beneficial to the occurrence of hepatocellular carcinoma.
If you want to know more, please click here. More detailed information can be found in the "Detail" button on the search page.
If you want to know more, please click the references below.
Liu Y X , Li Q Z , Cao Y N . The effect of key DNA methylation in different regions on gene expression in hepatocellular carcinoma[J]. Molecular Omics.Analyze the data used:
The gene expression data [fragments per kilobase of exon model per million mapped fragments (FPKM) and COUNTS], DNA methylation data (HM450K), and clinical data (hg38) of breast cancer and paracancerous tissues from the TCGA (The Cancer Genome Atlas) database. The human reference genome annotation file RefSeq gene (hg38) and the location file of CGI from UCSC. The position file of the enhancer from the FANTOM5 (Function Annotation of The Mammalian Genome) database.
Based on the RefSeq genes annotation file, the genome was divided into the following twelve regions:
Promoter
, 5' UTR
, 3' UTR
, intergenic
, enhancer
, N_Shore
, S_Shore
, N_Shelf
, S_Shelf
, exon, intron, CGI regions.
The 12 regions are further divided:
The promoter region was evenly divided into 30 bins, where each bin was 100 bp. The other 11 regions were normalized into 10 bins.

Tips:Hyper means hypermethylated;Hypo means hypomethylated;
Analysis result of figure above:
In both sides of CGI, intergenic regions, and intron regions, the degree of enrichment for hypomethylated probes is higher than that for hypermethylated probes. The hypermethylated probes are highly enriched in CGI and promoter regions. Then normalized the number of probes distributed in each region according to the length of each region. The enrichment degree of hypermethylated probes is higher than that of the hypomethylated probes in CGI, enhancer regions, and promoter regions. In other regions, the enrichment degree of hypomethylated probes is higher than that of hypermethylated probes. Hypermethylated probes are more significantly enriched in CGI and promoter regions after normalization by length. The hypermethylated probes in CGI and promoter regions are highly enriched both before and after normalization.Most of the hypermethylated probes in the promoter region are located on the CGI. The number of hypermethylated probes is almost the same as the number of hypomethylated probes in the promoter region without CGI. It can be speculated that the enrichment of hypermethylated probes in the promoter region is caused by the enrichment of CGI.

Analysis result of figure above:
The total number of ADMPs(abnormal DNA methylated probes) in up-regulated genes is less than that in down-regulated genes. The number of up-regulated genes is about 1.5 times that of down-regulated genes, which further shows that ADMPs like to be enriched in down-regulated genes. The number of probes enrichment in the 5′UTR and 3′UTR of the up-regulated genes is almost the same, and the same is true in the down-regulated genes. The number of hypermethylated probes in the promoter and exon regions of up-regulated genes is about twice the number of hypomethylated probes, and the same pattern is observed in the exons of down-regulated genes. However, the number of hypermethylated probes in the promoter region of down-regulated genes is 6.5 times that of hypomethylated probes.
If you want to know more, please click here. More detailed information can be found in the "Detail" button on the search page.
If you want to know more, please click the references below.
Cao Y N, Li Q Z, Liu Y X. Discovered Key CpG Sites by Analyzing DNA Methylation and Gene Expression in Breast Cancer Samples[J]. Frontiers in Cell and Developmental Biology, 2022, 10: 53.Analyze the data used:
The DNA methylation and gene expression data of human BRCA tissues from the publicly available The Cancer Genome Atlas database. Choose the 109-th batch Illumina Infinium HumanMethylation450 Beadchip and RNASeqV2 level three data. The human reference genome annotation file RefSeq gene (hg19) from UCSC.
Based on the Illumina Infinium HM450 array annotation file (hg19), the genome was divided into the following six regions:
TSS1500
, 5' UTR
, 3' UTR
, TSS200
, gene body
, 1stexon
Genome-specific sites:
CGI
DHS
enhancer

Analysis result of figure above:
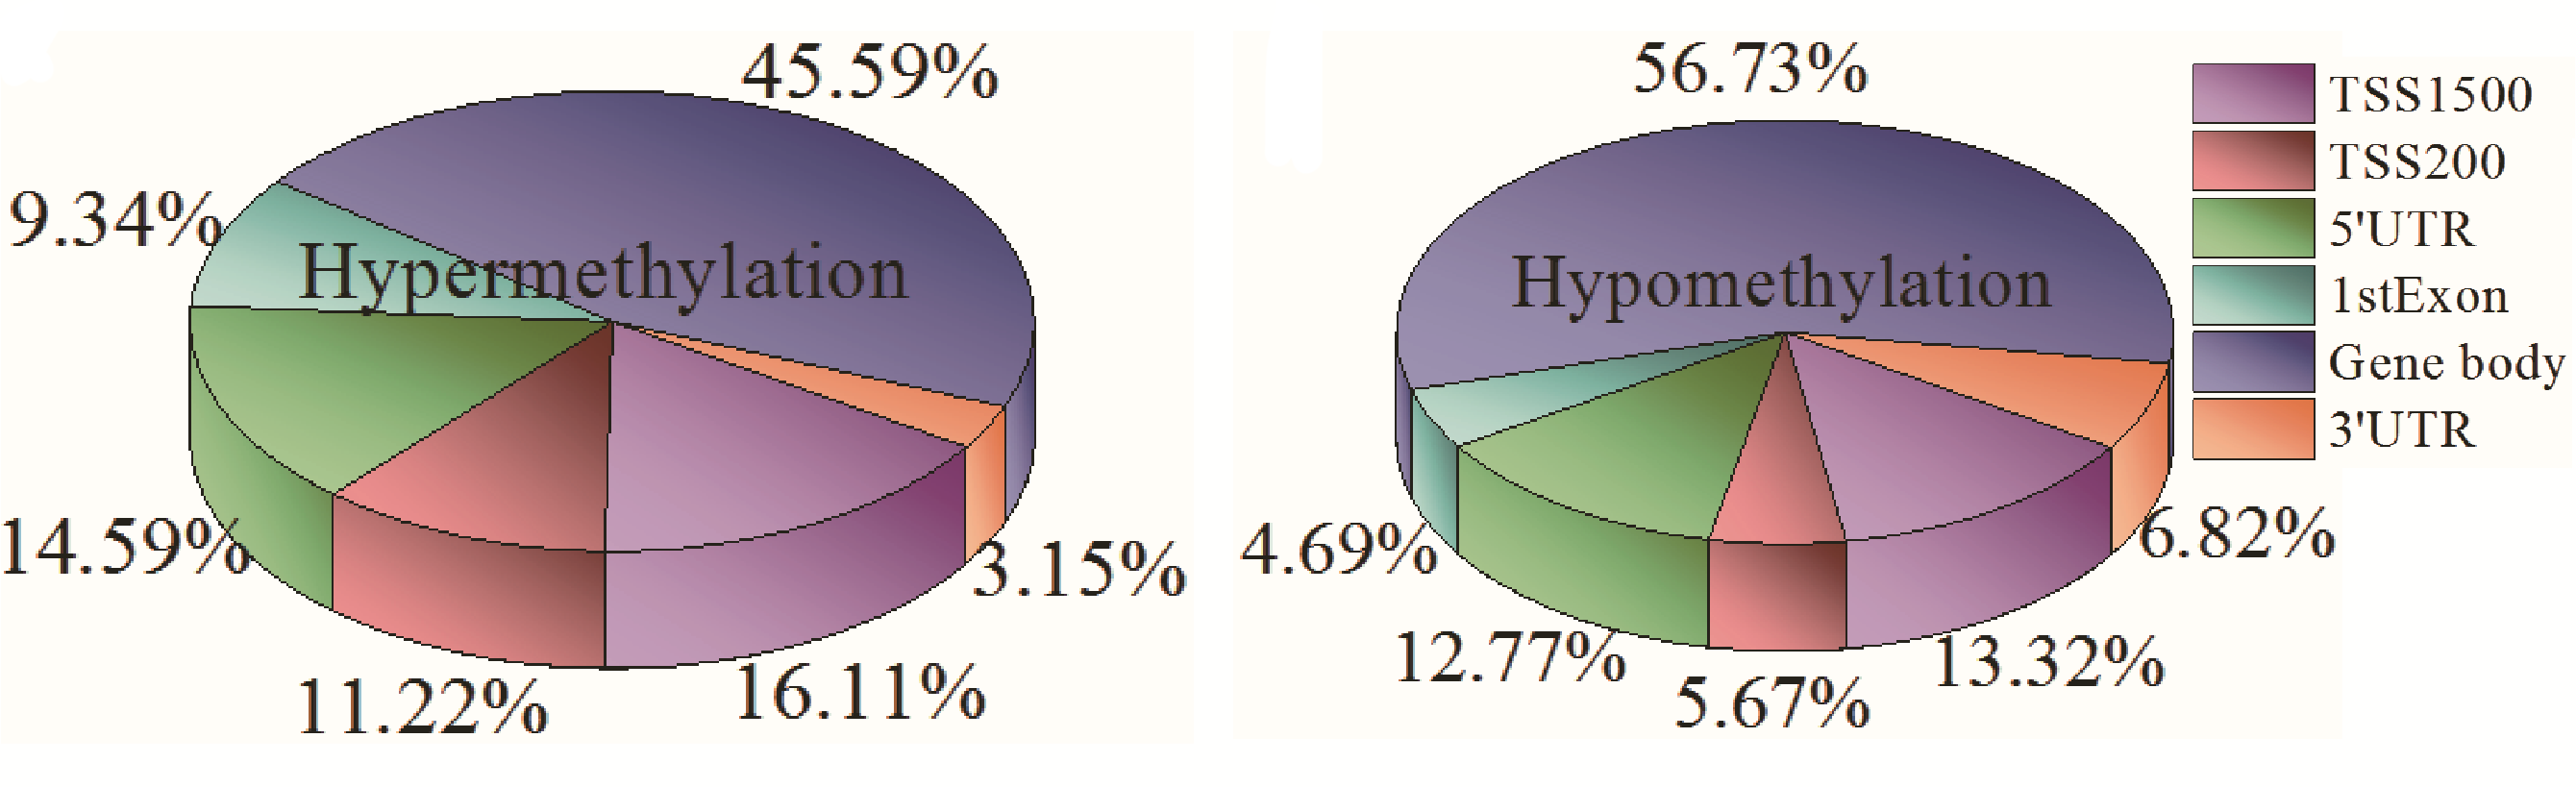
For the distributions of hypermethylated CpG sites in the six regions, the proportion of gene body region is the highest, which reaches at 45.59% of the total number of hypermethylation sites of the six regions. However, TSS1500, TSS200, 5'UTR, 1stExon, and 3'UTR account for 16.11%, 11.22%, 14.59%, 9.34%, and 3.15%, respectively. The distributions of hypomethylated CpG sites of the six regions are that gene body region is also the highest proportion, 56.73% of the total number of hypomethylation sites of the six regions. Second, TSS1500 is 13.32%. Nevertheless, the proportion of 1stExon in hypomethylation is the lowest, 4.69%. Then, TSS200 is 5.67%. 5'UTR is 12.77%, and 3'UTR is 6.82%. Gene body region enriches the highest of hyper- and hypomethylation sites compared with the other five regions in breast tumor tissue.

Analysis result of figure above:
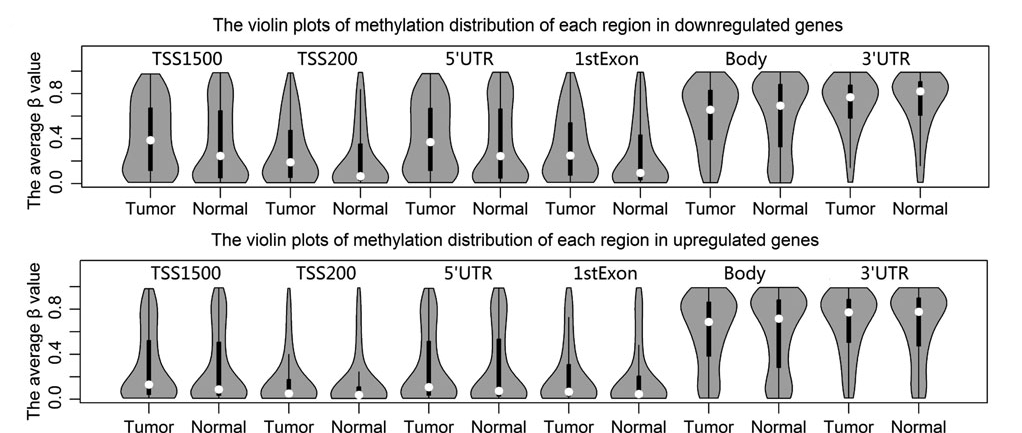
The methylation distribution difference between the two tissues in each region is more visible in downregulated genes than upregulated genes, particularly promoter region (including TSS1500, TSS200, 5'UTR, and 1stExon regions). DNA methylation has a very strong effect on the downregulation of gene expression in breast cancer, especially promoter methylation. The average b values in TSS1500, TSS200, 5'UTR, and 1stExon regions are lower, whereas gene body region and 3'UTR are higher for down- and upregulated genes in breast cancer tissue. In the downregulated genes, the methylation distributions of the two tissues are markedly different at TSS1500, TSS200, 5'UTR, and 1stExon regions. For instance, the distributions of TSS1500 region and 5'UTR are more dispersed, their density of high methylation is greater in tumor than normal tissue, and their methylation medians in tumor are higher than that of normal tissue.

Analysis result of figure above:
Hypermethylation sites, 44.54%, enrich in CGIs and 31.42% and 24.04% of these sites locate on DHS and enhancer regions, respectively. For the hypomethylation sites, only 14.01% of them distribute in CGIs, and 22.84% of them are DHSs, whereas the number of these sites enriched in enhancer region is up to 63.15%. In the downregulated genes, hypermethylation sites mainly distribute in CGIs. In the upregulated genes, hypomethylation sites principally distribute in enhancer regions. It is illustrated that the downregulation of genes is related to CGI hypermethylation, and the upregulation of genes is closely correlated with enhancer hypomethylation.

Analysis result of figure above:
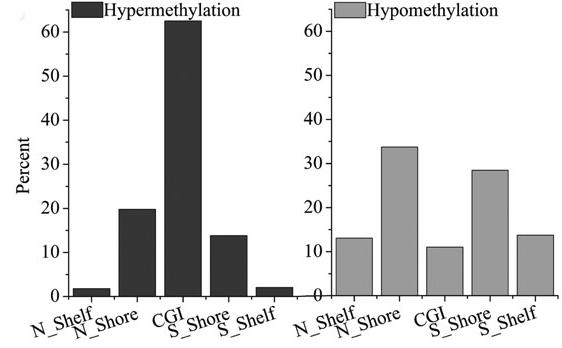
In these regions, the hypermethylation sites in downregulated genes are primarily concentrated in CGI and its proportion is the highest. In contrast, the hypomethylation proportion in CGI for up-regulated genes is the lowest. About 62% of the hypomethylation sites in upregulated genes are enriched in N_Shore and S_Shore regions. In other words, the hypomethylation of shore region plays important roles in gene expression regulation for breast carcinoma.
If you want to know more, please click here. More detailed information can be found in the "Detail" button on the search page.
If you want to know more, please click the references below.
Jin W, Li Q Z, Zuo Y C, et al. Relationship between DNA methylation in key region and the differential expressions of genes in human breast tumor tissue[J]. DNA and cell biology, 2019, 38(1): 49-62.